Guest post by Anthony Zambelli.
Blackboard now allows you to run an item analysis on any test you've deployed in it. Although not necessarily the intent of item analysis, you now have a
new and powerful tool to assess your students’ achievement of student learning outcomes when you administer your assessments in Blackboard.
Item analysis provides statistics on overall test performance and individual test questions. Although item analysis is intended to help you recognize
questions that might be poor discriminators of student performance so that you can improve questions for future test administrations or to adjust credit on
current attempts, it can also be used to assess student achievement of student learning outcomes.
You will be using the Question Statistics Table on the Item Analysis Page to assess your SLOs. You can run item analyses on deployed tests with submitted
attempts, but not on surveys. Access previously run item analyses under the Available Analysis heading or select a deployed test from the drop-down list
and click Run to generate a new report. The new report's link appears under the Available Analysis heading or in the status receipt at the top of the page.
For best results, run item analyses on single-attempt tests after all attempts have been submitted and all manually graded questions are scored.
Just follow the following instructions on running item analysis on a test:
You can access item analysis in three locations within the assessment workflow. It is available in the contextual menu for a:
- Test deployed in a content area.
-
Deployed test listed on the Tests page.
-
Grade Center column.
- Access the test's contextual menu.
-
Select Item Analysis.
-
In the Select Test drop-down list, select a test. Only deployed tests are listed.
-
Click Run.
-
View the item analysis by clicking the new report's link under the Available Analysis heading or by clicking View Analysis in the status receipt at the
top of the page.
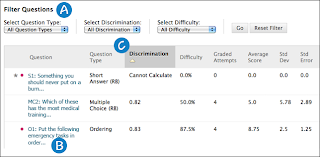
You are now ready to use the data that is generated to assess your students’ achievement of SLOs. The question statistics table provides item analysis
statistics for each question in the test.
-
Filter the question table by question type, discrimination category, and difficulty category.
-
Investigate a specific question by clicking its title and reviewing its Question Details page.
-
Statistics for each question are displayed in the table, including:
-
Discrimination: Indicates how well a question differentiates between students who know the subject matter those who do not. A question is a good discriminator when students who answer the question correctly also do well on the test. Values can range from -1.0 to +1.0. Questions are flagged for review if their discrimination value is less than 0.1 or is negative. Discrimination values cannot be calculated when the question's difficulty score is 100% or when all students receive the same score on a question.
-
Difficulty: The percentage of students who answered the question correctly. Difficulty values can range from 0% to 100%, with a high percentage indicating that the question was easy. Questions in the Easy (greater than 80%) or Hard (less than 30%) categories are flagged for review.
-
Graded Attempts: Number of question attempts where grading is complete. Higher numbers of graded attempt produce more reliable calculated statistics.
-
Average Score: Scores denoted with an * indicate that some attempts are not graded and that the average score might change after all attempts are graded. The score displayed here is the average score reported for the test in the Grade Center.
-
Standard Deviation: Measure of how far the scores deviate from the average score. If the scores are tightly grouped, with most of the values being close to the average, the standard deviation is small. If the data set is widely dispersed, with values far from the average, the standard deviation is larger.
-
Standard Error: An estimate of the amount of variability in a student's score due to chance. The smaller the standard error of measurement, the more accurate the measurement provided by the test question.
You will be only interested in the Average Score column when assessing student achievement of SLOs by following the following steps:
- Identify the SLO that is being assessed by the question.
-
Determine a satisfactory score that indicates that your students have achieved that SLO.
-
Compare your satisfactory score to the average score. If that score is greater than or equal to the satisfactory score then your students have achieved
the SLO which you will report in TracDat. If the average score is less than your satisfactory score, then the students didn’t achieve the SLO and that
may be an SLO you may want to work on the next time the course is taught, again reporting in TracDat.


